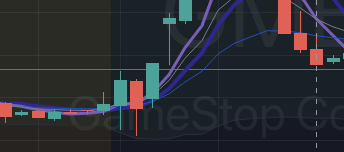
SMMT started forming a bull flag after a curl up. I thought the 1 minute would break out when it started going green after a red candle but alas, this was a minute setup. The first red candle appeared on 5 min. Usually there’s 3 red candles (or 1 depending on the strength of the stock). This one had a false break out (pointed by yellow arrow to the left) , which should have been an indicator to stay away (or at least be cautious)
1.4 was support. It went to support and then we see another false break out. Two false break outs , is probably a good indicator of the bull flag not working out. It didn’t break support, which is what I expected from a failed break out . It went to support and then up to resistance then broke support . Probably because volume wasn’t too high ?
How can we trade this ?
Wait for first green candle to make a new high
This was choppy on 1 minute but on 5 minute, we can see that the green candle (after the first red candle) didn’t go above the red candle. Safe bet would be to wait for the 5 min candle’s high to be above the red candle and buy on a pullback after that OR at that point with stop loss right below the low of the red candle. First PT would be HOD (which was 1.55). The high of red candle was 1.5, so the buy order would have been at around that. The low of the red candle was 1.43 so SL could be 1.4 (since we didn’t know at that point that 1.4 was support)
The stock wasn’t moving that fast , we could have waited and optimized the buy price at 1.48.
Anticipate the break out
As the green candle approached the high of the red candle, we can buy anticipating a break out (which would be a bit riskier) but if it worked out the P/L ratio would be better than waiting for the first green candle to make a new high . SL would be bottom of the previous candle (which is red)
Trade the range
Right before the second false break out, it’s pretty obvious the support is at 1.4 . We could buy at 1.4, SL at 1.38 and PT would be a cent or w below descending resistance.


Leave a Reply