This will be (hopefully) the first of many strategy posts I write. My primary motivation for this is to keep track of strategies I know and/or thinking of executing trades on. The reason I call this the G-Man pullback is because I read it in “The Playbook” and GMan (Gilbert Mendez) teaches this strategy to a bunch of students in Singapore in that book.
I don’t short stocks (not allowed in my religion – Islam) so my strategies will always be long strategies but there is no reason you can’t use them for shorting stocks.
GMan pullback is a beginner friendly strategy which is easy to understand and execute. The awesome thing about it is, you can set you sell price and your stop-loss and walk away. Keeps emotions out of trading. And, most importantly, you don’t have to be at your desk watching the stock (for the most part).
The Strategy
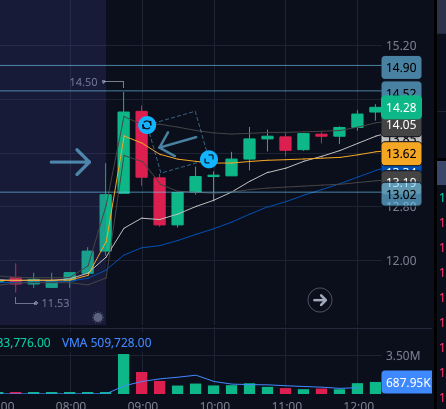
When a stock has a lot of interest in the market , it will start to go up. Usually because a hedge fund is adding to its position or because there is a lot of retail interest in it. We don’t enter during this phase but instead wait for a pullback.
When the stock gets over extended, it will start pulling back. The pullback should have lower volume, and at least 4 candles. This will help us establish a trend for the pullback. As soon as there is a candle that closes above resistance of trend, we enter the trade. The stop loss is the bottom of the swing low and the first price target is the high of the previous swing high.
The second price target is the break of the trend of the second leg going up.
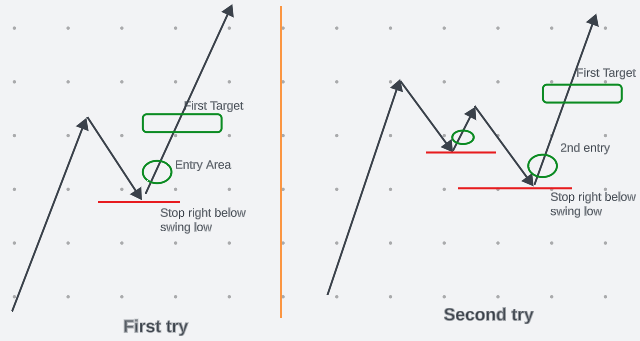
As mentioned in the image above, if you get stopped out, then you can look for another entry (which has a higher probability of success). The first price target for second entry is also the first swing high. GMan risks about 10% intraday loss on first entry and 25% on second entry.
GMan pullback requires 2 time frames. First time frame is the one you trade in. The second one, a higher time frame is to make sure the trend is still going in your favor. For example, if you are trading the 1 min chart, then you can use the 5 min chart to confirm the trend is still going up.If you are using 15 min chart to trade, you could use 1 hour chart for confirming the trend.
For those, that are comfortable holding positions overnight, trading the 1 hour chart might be ideal (with daily chart for trend confirmation). Basically, the time frame you use to confirm the trend should be at least 5 candles sticks more than your trading time frame. Thus, for 1 min, we use 5 mins. For 15 min, we use 1 hour. And, so on and so forth.
This strategy can be combined with fibonacci levels and tape reading to load the boat with minimal risk.
Summary
- Look for a powerful opening drive with high relative volume for the time frame you are trading in.
- The direction of the opening drive should be in the direction of the trend in a higher time frame. For example, if you are trading a 15 min chart, then the opening drive should be in the direction of the trend of the hourly chart.
- Wait for a lower volume pull/back with at least 4 candles in the pullback leg. This is key. It creates a high probability trade setup
- Establish resistance trend for the pullback and enter the trade when a candle closes above the resistance line in the trading time frame. The trend in the higher time frame should be going up (green candle)
- More than 50% of the first entries end up getting stopped out. Second entry provides a higher probability setup and makes more money. There is no third entry. This strategy is profitable even with 20% accuracy.
Stocks this works for :
- High relative volume in the time frame you are trading
- High volume opening drive
- Low volume pullback (lower than the volume of opening drive)
Notes:
- GMan trades in tiers (5 tiers in total). For every tier he risks 5% of his daily stop. So, for tier 1, he risks 5% of is daily stop; 10 for tier 2, etc.
- You can use previously established levels to start a feeler position without gaining confirmation. Once you get the confirmation (with the break of the trend line – a candle closing above resistance) you can add to the position
- Add on tight consolidations near previous swing highs
- When trading the hourly chart (which is what GMan likes to trade in), it could take two or three days to hit the first target. Sometimes, it can take 4 days. In a super strong stock, it can take a day
- The positions that get to the first target quickly are usually the ones that have good follow-through
- 1 – 3 min intraday charts are great for scalping volatility. 20% of GMan’s trades are within this time frame generating $500 to %1000 a day
- 1 – 5 min intraday charts can be great for intraday swing trading
- 15 min charts are great for 2-4 hour setups. 20 to 30 percent of the time you can hold these positions overnight.
Leave a Reply