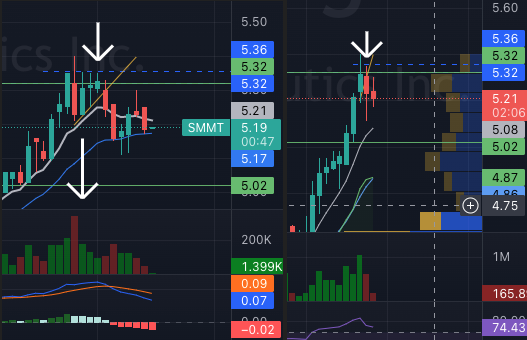
The chart on the left is 1 min and right is 5 min .
On 1 min, there is a flat-top wedge forming. which is generally a continuation pattern (from what I have read) but there was a HUGE red candle and
- the green candle volume wasn’t that much
- green volume was declining , which meant the trend was going to reverse.
- stock wasn’t moving past 5.36
- Alhamdulillah I saw this pattern before it happened. I saw the wedge afterwards but the volume and price action I saw before.
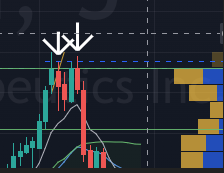
- Now, looking at the 5 mins chart, it looks like a bull flag is forming. So there is still chance for uptrend and the pull back is most likely short term. The long wicks on top at a concern though. I got distracted while trying to save this note and the chart moved a bit more. Sure enough, it went back up to HOD before going back down (double top).
Leave a Reply